Where it started
Sound → pixels was the whole brief.
One page. One canvas. One effect. It was rough, but it was alive.

I started Audio Visualizer after OpenAI Dev Day in London in 2024. Their audio visualizations were mesmerising. I wanted to understand how sound could become something you could see, so in January 2025 I made the smallest version I could: choose a track, run it through the Web Audio API and let it push a grid of green pixels out from the centre.
That literal first build was green and mapped frequency ranges across a centre-out grid. Over the next few days it became a blue radial ripple driven by the strongest part of the signal, with drag and drop, playback controls, a timeline and video export. System-audio capture came later. More importantly, it had an identity.
What ThorstenClip taught me
Along the way, I built ThorstenClip to find out how much further the idea could go. I moved the stage to the centre, gave the sound a richer vocabulary, explored waveform and radial compositions, and treated the exported result as authored media instead of a decorative browser effect.
I did not want Audio Visualizer to become ThorstenClip with a different logo. I wanted to bring back the strongest ideas without bringing its name, red identity or transcription-led direction with them.
AV/01
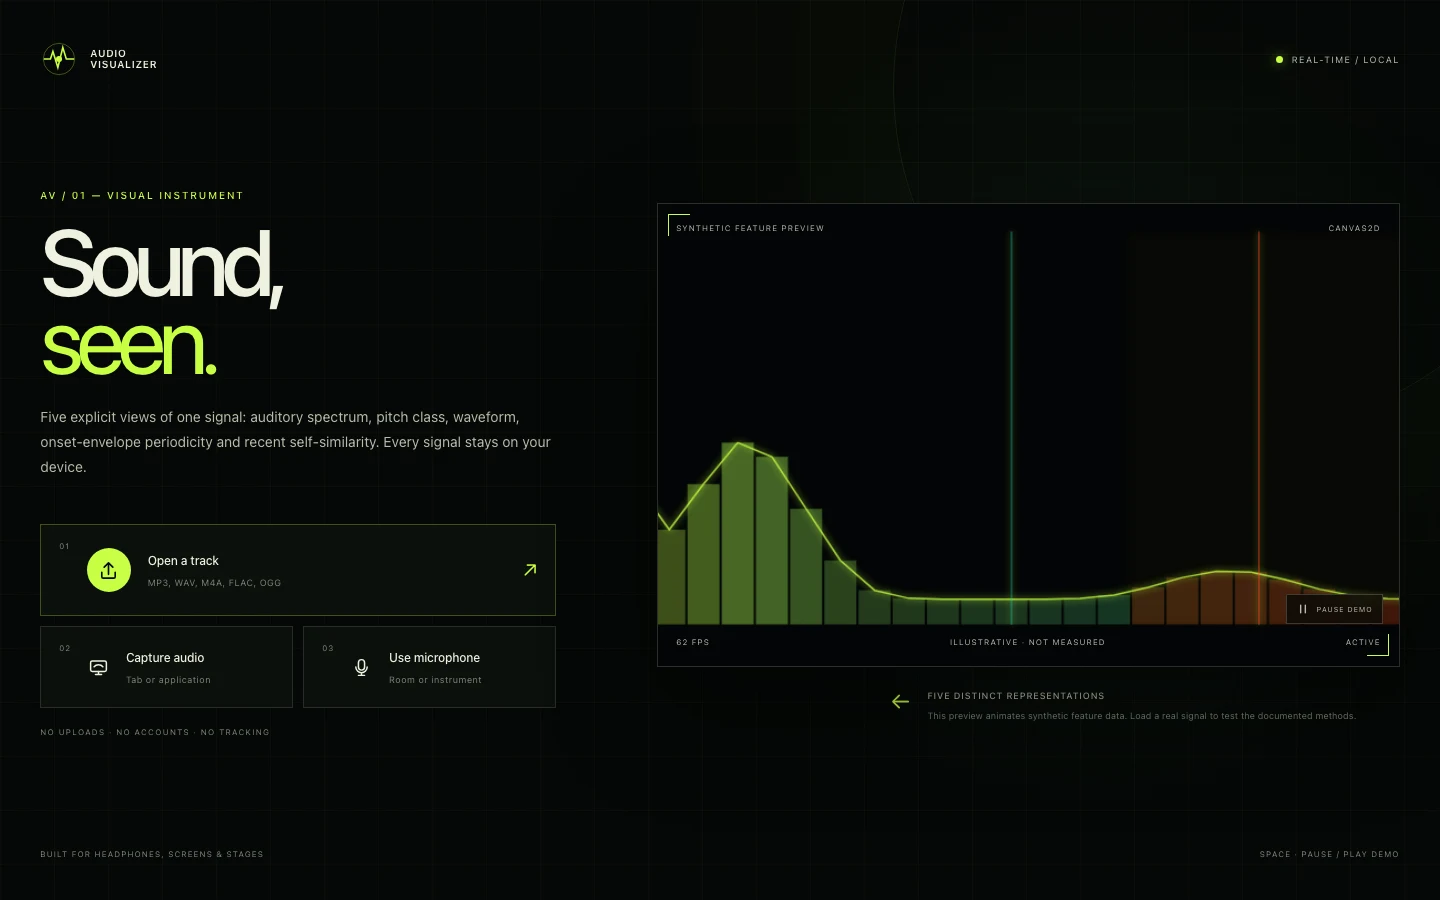
AV/01 is the result. It accepts a local track, shared tab or application audio, or a microphone, then carries the active source through one analysis path into the stage. I can shape sensitivity, intensity, glow, detail, colour and frame, save a still, or record the performance with its audio in the browser.
A visualizer can be expressive without pretending it knows more than it measures.
The first AV/01 release established the instrument: five genuinely different visual systems, WebGL 2 with a distinct Canvas 2D fallback, a real waveform transport, responsive layouts and one coherent path from live preview to recording.
The scientific-analysis update raises the standard again. Every scene now has a stable claim ID, a documented signal representation, one narrow question it can answer and one stronger claim it must refuse. The method belongs next to the visual, not hidden behind it.
Five scenes. Five bounded questions.
Auditory Field · AV01-SCI-001 groups the browser's short-time spectrum into 24 ERB-rate-spaced triangular regions and exposes spectral centroid, rolloff and a high-frequency power ratio. It shows how RMS-like spectral magnitude varies across those regions now. It does not separate sources, recognise instruments, model masking or represent an individual listener's hearing.
Each scene needs a question it can answer and a claim it refuses to make.
Tonal Orbit · AV01-SCI-002 folds spectral energy into twelve pitch classes and shows how concentrated that energy is. It does not identify a played note, octave, tuning, chord or key.
Temporal Scope · AV01-SCI-003 draws the recent mono waveform with RMS, sample peak, crest factor and zero-crossing rate. It shows amplitude changing inside the current analysis window. It is not calibrated SPL, LUFS, stereo phase or a laboratory oscilloscope measurement.
Rhythm Lattice · AV01-SCI-004 combines positive spectral change with short-term autocorrelation to show onset evidence and a periodicity candidate. It does not confirm a beat, downbeat, tempo, meter or groove.
Recurrence Atlas · AV01-SCI-005 compares recent, level-normalised spectral shapes in a rolling self-similarity matrix. A brighter off-diagonal cell means two moments inside the recent history resemble each other. It does not label a verse, chorus, motif, source or structural boundary.
The evidence boundary
The differentiator is representation, not skin. Equal-RMS low and high tones move Auditory Field without changing the level control. A3 and A4 move through spectrum and waveform while Tonal Orbit keeps the strongest pitch class at A. Polarity changes Temporal Scope without changing magnitude-derived evidence. Periodic and jittered transients separate in Rhythm Lattice. A–B–A and A–B–C spectral shapes separate in Recurrence Atlas. Those controls demonstrate five different implementations; they do not prove that my colours and geometry are perceptually superior. The visual mappings are still authored interpretations, and the papers and standards behind them do not endorse AV/01.
The audit caught exactly the kind of mistake this contract is meant to catch. A sustained 6 kHz tone briefly appeared as a 200 BPM-equivalent candidate because autocorrelation found weak numerical modulation with no credible transient sequence. I rejected that result. The final Rhythm Lattice keeps the smoothed onset envelope for periodicity but gates it with separately detected, hysteretically spaced candidates from the unsmoothed adaptive spectral-change target. The negative tone now stays at zero periodicity while 90, 120, 180 and 200 BPM-equivalent controls remain recoverable. The rest of the boundary still applies: the browser analyser downmixes to mono, the spectral branch is Blackman-windowed, the waveform branch is not, and the nominal 50 Hz clock can move with scheduling and power policy. This is browser signal analysis, not a calibrated acoustic instrument.
That is why the limitations now sit inside the instrument and why I wrote down the formulas, timing windows, failed controls and source trail in the scientific contract. The release gate now includes 34 deterministic tests, reproducible hashes for nine signal fixtures and three optimised-browser journeys. Four fresh browser runs placed the periodic 120 BPM-equivalent control at 119.65–120.06 with 0.8774–0.9221 evidence, while the matched jittered control stayed at 0.2714–0.3534; the score is an engineering display, not a probability. Live-capture integration remains partial: system-capture and microphone permission and settings negotiation were not exercised in this review, and the defined long-session gate is still open. This is internal validation against the declared contract, not peer review, perceptual validation, metrological certification or scientific proof that AV/01 is better than another visualizer.
For every active user source, the same audio graph, feature frame, scene, palette and settings drive what I see and what I record. For a file, the media playhead coordinates transport and full-track export. The renderers consume no autonomous presentation clock. The landing experience is a separately labelled deterministic synthetic preview. It is never presented as measured audio and never fills in for a missing live signal.
What I learned
The first version taught me that the Web Audio API could make sound feel physical. ThorstenClip taught me to think about composition, hierarchy and output. AV/01 taught me that technical ambition gets stronger when the evidence boundary becomes part of the design.
It also reminded me that progress does not require pretending the old work never existed. The green grid was not a failed version of AV/01. It was the experiment that made AV/01 possible. The literal first build and completed original release are still preserved as the origin-green-grid and v0.1.0-original tags.
Open AV/01, explore the source, read the full build story, or inspect the scientific contract and provenance.
The goal is to build the most expressive browser-native audio visualizer I can: signal-aware, visually distinctive, technically honest and open enough for someone else to make the result their own.
The green grid is still in there. AV/01 is that first idea grown into an instrument with a clearer contract.